Phase Extraction Extension
The Phase Extraction Extension can be used to generate a resampling curve for k-linearization by extracting the phase of a calibration signal.
How it works
The plugin extracts the instantaneous phase of a calibration signal and uses it to generate a resampling curve for k-linearization. The processing steps are shown in the figure below.
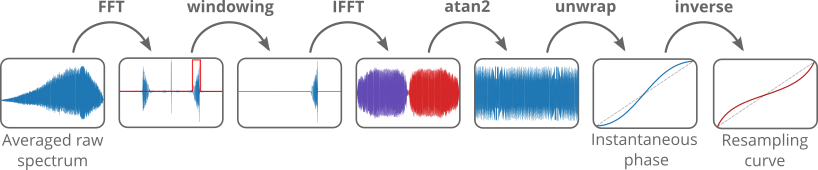
First, one or multiple buffers of raw data are acquired and averaged. The averaged interferogram is Fourier-transformed, and a window is applied to isolate the calibration signal in the positive sideband. This windowed signal is then inverse Fourier-transformed, resulting in a complex signal. The phase is extracted using atan2 on the real and imaginary parts, then unwrapped to obtain the instantaneous phase. Finally, the instantaneous phase is inverted to get the resampling curve. The inversion can be thought of as swapping the axes or mirroring the phase signal along the 45° diagonal.
This method also works in the presence of a sample signal, as the averaging and windowing steps suppress most unwanted contributions, leaving only the calibration signal.
Further details can be found in this conference paper.
How to Use
- Start OCTproZ processing.
- Generate a calibration signal, for example by placing an optical window in front of the OCT reference mirror.
- Open the Phase Extraction Extension and fetch raw data using the Fetch button.
- Select A-scans for averaging (typically, selecting All works best, but you can also choose a specific range) and click on Average.
- Select the calibration peak by setting the Start and End positions, then click on Analyze.
- In the Results area, you can choose to ignore a number of samples at the beginning and end of your signal. This is useful if your interferogram is zero or close to zero at the edges. Then, click on Fit.
- Use the result by either transferring the coefficients of the polynomial fit to the OCTproZ sidebar via click on Transfer coeffs, or by using the raw resampling curve. For the latter, click on Transfer curve to automatically apply the curve to OCTproZ processing, or click on Save curve to export the raw resampling curve as a CSV file.
Note
It is important that the calibration signal is free from phase distortions caused by dispersion imbalance. Otherwise, the extracted instantaneous phase will include both the dispersion-related phase and the phase caused by non-linear k-sampling, and the resulting resampling curve will not correctly linearize the data in k-space.
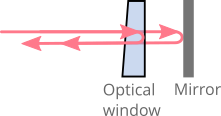
A very simple way to generate a calibration signal that is free from dispersion imbalance is by placing a wedged optical window or an optical window with an anti-reflection coating on one side in front of the reference mirror. The light is mainly reflected back from the back surface of the optical window and the mirror. The back-reflected beams interfere with each other, generating an autocorrelation signal. The optical window should be thick enough so that any possible autocorrelation signal from the front and back surfaces of the window does not appear within the OCT imaging range, or at least does not overlap with the calibration signal. The distance between the back surface of the optical window and the mirror should be chosen such that the calibration signal appears somewhere in the bottom half of the B-scan.
The following image illustrates the basic idea of how the autocorrelation signal is generated using the optical window–mirror combination.
A video demonstrating the use can be found here
Demo data set
A demo dataset can be found here. You can use it with the Virtual OCT System to test the Phase Extraction Extension offline.
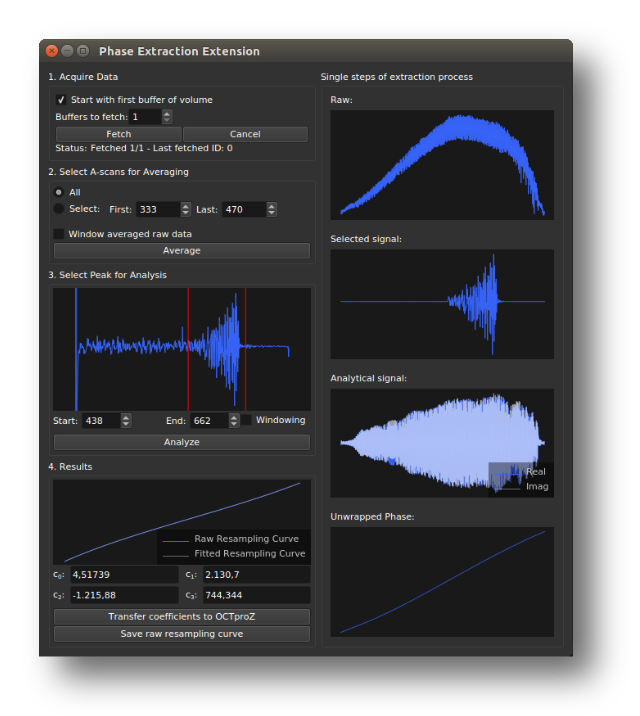
User interface
| Parameter | Description |
|---|---|
| Start with first buffer of volume | If checked, fetching starts from the first buffer of the volume. This should only be enabled if you have multiple buffers per volume and want to explicitly select a specific region for use in the Phase Extraction Extension. |
| Buffers to fetch | Number of buffers to fetch for averaging. |
| Select A-scans for averaging | Choose either All A-scans or specify a range using First and Last. |
| Window averaged raw data | If enabled, a Hann window will be applied over the entire averaged interferogram. |
| Start | Position (sample number) marking the beginning of the calibration peak. |
| End | Position (sample number) marking the end of the calibration peak. |
| Windowing | If enabled, a Hann window will be used instead of a rectangular window to isolate the selected calibration peak. |
| ignore first | Number of samples to ignore at the beginning of the interferogram during polynomial fitting. This is useful if the signal intensity is zero or close to zero at the start, to ensure a good polynomial fit. |
| ignore last | Number of samples to ignore at the end of the interferogram during polynomial fitting. |
| c0 to c3 | Coefficients of the polynomial fitted to the raw resampling curve. |
| Button | Description |
|---|---|
| Fetch | Start fetching the data. |
| Cancel | Cancel the fetching process. |
| Average | Start averaging the fetched data. |
| Analyze | Perform signal processing to generate the resampling curve. |
| Fit | Perform a polynomial fit on the raw resampling curve. This is usually done automatically, but if you change the values for ignore first or ignore last, you should run the fit again. |
| Transfer coeffs | Transfer the fitted coefficients \(c_0\) to \(c_3\) to OCTproZ. |
| Transfer curve | Transfer the raw resampling curve to OCTproZ. |
| Save curve | Save the resampling curve to a file. |