Visualization
For live visualization of the processed data in 2D and 3D, the user has access to three different output windows: B-scan, en face view and volume. B-scan and en face view are orthogonal cross-sectional slices of the volume, which can be maximum intensity projections or averaged layers of a user-defined amount of layers of the volume. For easier orientation, red marker lines can be overlaid to indicate the current B-scan slice position within the en face view and vice versa.
The interactive volume viewer displays acquired OCT volumes without cropping or downsampling in real time. As soon as one batch of data is processed, the corresponding part of the volume is updated and rendered. In order to avoid unnecessary data transfer to host memory, CUDA-OpenGL interoperability is used which allows the processed data to remain in GPU memory for visualization.
Volume rendering
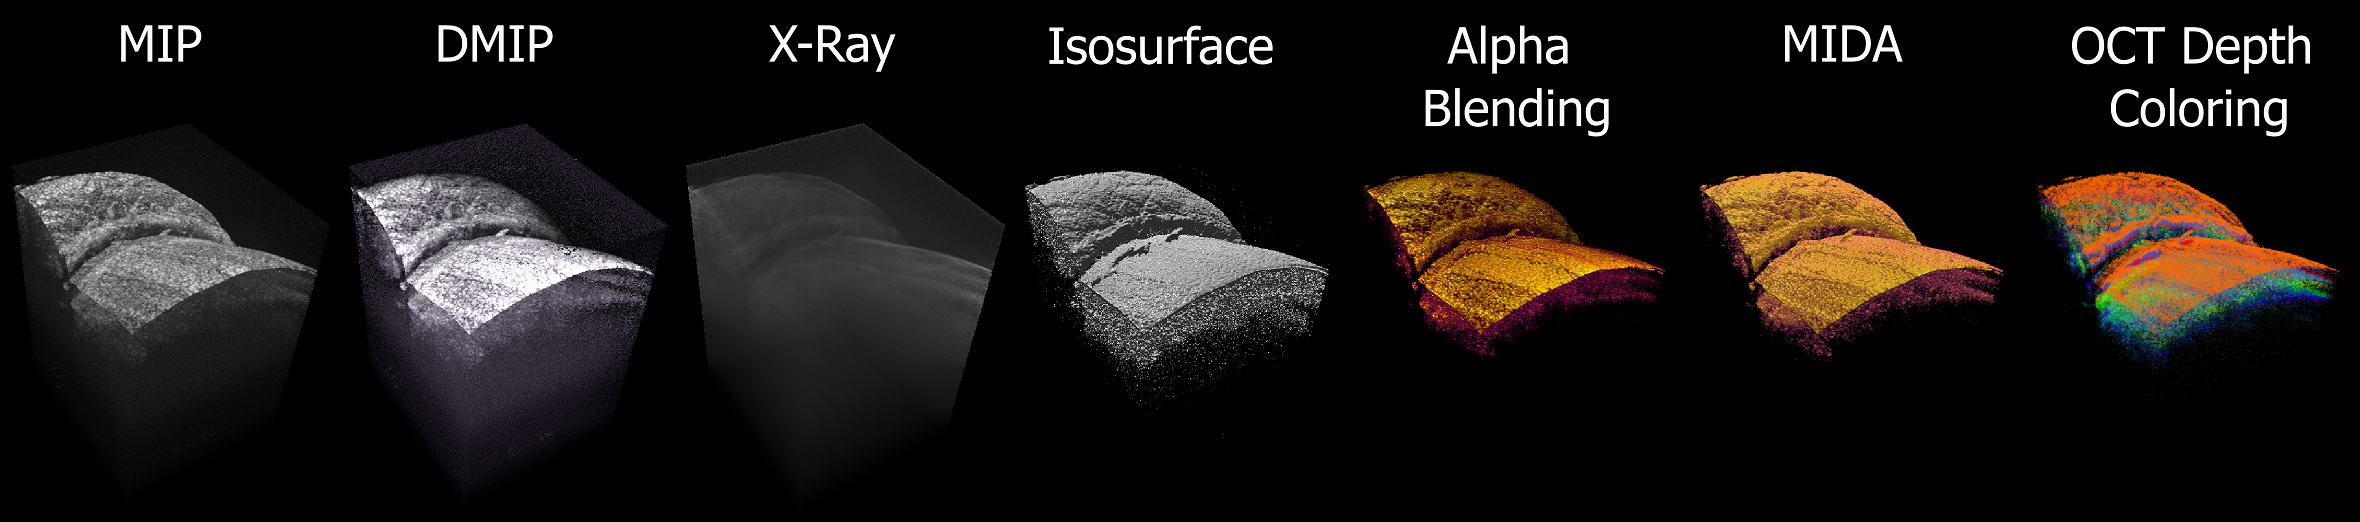
Here are some example images showcasing an OCT volume of a fingernail rendered using the implemented volume rendering techniques: